
Crypto Currency
$313M+ Raised! Is BlockDAG Ready to Outpace Solana in the Next DeFi Wave?
Solana became one of crypto’s headline names by offering speed above all else. Known by some as an “Ethereum killer,” its promise of over 65,000 transactions per second and minimal gas fees drew attention fast. But speed came with tradeoffs. Repeated outages, heavy validator control, and concerns about its growing size raised doubts about whether fast alone was good enough. Now, BlockDAG (BDAG) is stepping into that space. It isn’t just copying Solana’s strong points. It’s also responding to the flaws.
With more than $313 million already raised in its presale, a $600 million target in sight, and over 2 million users mining on its X1 app, BlockDAG is further along than many expect. For those watching what might shape the next DeFi phase, this Layer 1 is working to strike a better balance between speed, stability, and ease of use.
Looking Beyond Speed in the Layer 1 Race
Solana picked up momentum in 2021 and 2022, especially across NFTs and retail dApps. But the same fast design that made it popular also created problems. It ran on a Proof-of-History model that delivered speed but hadn’t been tested at scale. That led to breakdowns. Between 2021 and 2023, Solana went offline at least seven times.
This caused real concern. Apps couldn’t count on constant uptime. Some users lost access during outages. And confidence started to fade, especially for serious DeFi use.
BlockDAG takes a different route. It uses DAG to enable fast, parallel transactions but adds Proof-of-Work for deeper decentralization and network protection. This approach pulls from Bitcoin’s durability while offering speeds that reach 15,000 transactions per second.

Where Solana went all-in on speed, BlockDAG is focusing on reliable performance. The design aims to scale without cutting corners, keeping the network secure and steady even during heavy use.
How BlockDAG Is Building Before It Launches
What sets BlockDAG apart is how it’s preparing before going live. Many chains, like Solana, focused mainly on getting their mainnet out first. BlockDAG is doing it differently. Its testnet is already active, it works with Ethereum tools, and it has a no-code dApp builder that lets people create smart contracts without needing to code.
More than 23 billion BDAG coins have been sold already, showing strong interest well before its official launch. That early traction is similar to Solana’s early growth, but BlockDAG seems to be doing it in a more structured way, starting with tools, not adding them later.
Here’s a quick comparison:
- Solana grew after going live; BlockDAG is gaining ground before launch.
- Solana’s developers had to make their own tools; BlockDAG is giving them ready-to-use options.
- Solana dealt with slowdowns during peak times; BlockDAG is planning for high speed from day one.
This approach is why some analysts are starting to see BlockDAG as more than just another Layer 1. It could be a stronger base for running DeFi, dApps, and DePIN tools without facing technical problems.
Planning for Liquidity and Early Visibility
BlockDAG is also thinking ahead when it comes to liquidity. Unlike Solana, which leaned on grants and early-stage funding, BlockDAG is getting all its support from its community. Its $600 million crypto presale goal will help it:
- Add liquidity across more than 20 exchanges (5 already confirmed)
- Finish its core systems before going public
- Provide early support to developers through grants and tools
- Launch key DeFi features like a bridge, DEX, and lending tools before its listing
On top of that, BlockDAG is already getting attention beyond the crypto world. It has a partnership with Inter Milan and is planning a new campaign in the U.S. These kinds of moves are similar to Solana’s push into sports and apps for regular users, but BlockDAG is doing it earlier in its journey.
Could BlockDAG Reach Solana’s Market Level?
Solana is currently in the top 10 crypto projects with a market cap close to $70 billion. Could BlockDAG get there too? It’s still early, but the first signs are worth noticing. Take a look at how the numbers compare:
- Presale price: $0.0018 (ends June 20)
- Listing price: $0.05 (already confirmed)
- Estimated short-term price target: $1
- Longer-term outlook: Some analysts see potential for $4+ if progress stays on track
Reaching $1 could give BlockDAG a market cap around $50 billion, depending on how many coins are circulating. That would put it near Solana’s current level. Still, it’s not just about numbers. What really matters is how the rollout is handled.
BlockDAG already has a detailed six-week launch plan in place:
- Presale ends → Mining stops and staking ends
- Mainnet begins → Nodes and ASIC mining equipment go live
- DeFi features go online → Launchpad, DEX, and oracles are activated
- Coin goes public → 40% of coins are airdropped
In simple terms, the foundation is already there to grow, not just in tech and funding, but also in public interest.
Is This a New Kind of Layer 1?
Solana made a name for itself by focusing on speed first and worrying about decentralization later. BlockDAG is choosing a different path. It’s putting decentralization, strong developer tools, and steady growth at the center, while still aiming for high speeds and useful applications.
Solana won’t be pushed aside overnight. But history shows that projects which blend security and easy access and build strong user bases early tend to stay relevant. That’s what happened with Bitcoin. That’s what happened with Ethereum.
Now, BlockDAG might be on a similar path.
For people watching this space closely, it seems the chance to get in early is still available, but probably not for long.
Website: https://blockdag.network
Presale: https://purchase.blockdag.network
Telegram: https://t.me/blockDAGnetworkOfficial
Discord: https://discord.gg/Q7BxghMVyu


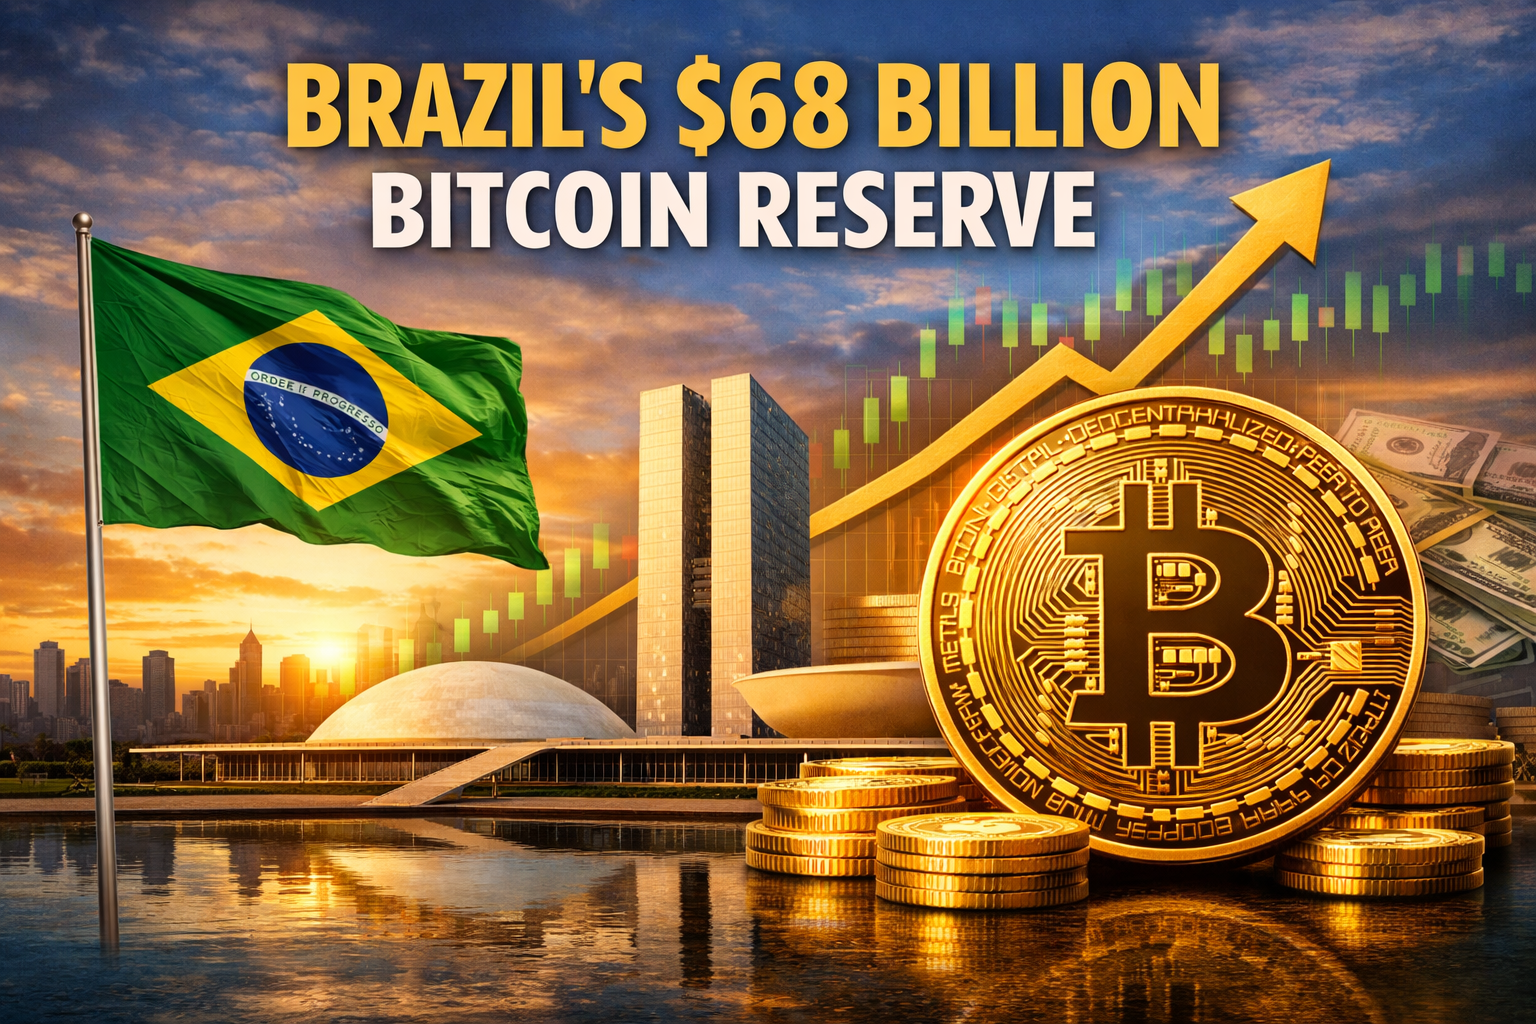
Brazil is once again moving toward a bold digital asset strategy as Congress reintroduces Bill 4501 of 2024. The proposal would allow the country to acquire up to 1 million BTC over the next five years, potentially creating the largest national Bitcoin reserve in the world.
Federal Deputy Luiz Gastão stated that building such a reserve could cost at least $68 billion. If completed, Brazil’s holdings would surpass those of countries like the United States and China. The broader objective is clear: diversify national assets, hedge against inflation, and reinforce Brazil’s economic sovereignty in an increasingly digital global economy.
Expanding Bitcoin Use Across the Economy
At the heart of the proposal is RESbit, the Strategic Sovereign Bitcoin Reserve. The reserve would be managed by the Central Bank in coordination with the Ministry of Finance. Importantly, the bill guarantees that Bitcoin held under RESbit cannot be confiscated and protects citizens’ rights to self custody.
According to Gastão, these protections are essential to encourage investment, support innovation, and provide long term legal clarity. The reserve would not rely solely on direct market purchases. It could also accumulate Bitcoin through tax payments, temporary ETF allocations, and corporate holdings.
Bill 4501 of 2024 goes further than simply establishing a reserve. It encourages companies to hold or mine Bitcoin and even permits federal tax payments in BTC. In addition, the proposal prohibits the sale of Bitcoin seized through court proceedings, preventing forced liquidation by the government.
The legislation positions Bitcoin as more than just a strategic asset. It frames the cryptocurrency as a tool for monetary sovereignty that could potentially support Drex, Brazil’s central bank digital currency initiative.
Congressman Eros Biondini, the bill’s author, emphasized Bitcoin’s scarcity and security features. He argued that these qualities make it either superior to or a strong complement alongside traditional reserve assets such as gold and the U.S. dollar. To ensure transparency, the bill requires the Central Bank to publish semi annual reports detailing RESbit transactions and performance metrics.
Governance and Legal Protections
The proposal includes strict accountability measures to prevent mismanagement. Article 6 outlines both administrative and criminal penalties for improper handling of RESbit funds. Officials responsible for violations would be required to reimburse public resources.
Furthermore, Brazil’s Internal Revenue Service would have 12 months to develop the technological framework needed to integrate Bitcoin into the national financial infrastructure.
However, legal challenges may arise. Current Central Bank regulations do not formally recognize Bitcoin as a reserve asset, which could create regulatory friction. The bill addresses user autonomy directly, stating that any administrative restriction on self controlled wallets would be considered void, reinforcing citizen custody rights.
Beyond reserve accumulation, the legislation aims to modernize Brazil’s broader financial ecosystem. It encourages international cooperation to adopt best practices and requires the Executive Branch to regulate and implement the law within 180 days of its publication.
If passed, Bill 4501 of 2024 could mark a historic shift in how Brazil approaches digital assets, placing Bitcoin at the center of its long term economic strategy.
Solana is undergoing a major transformation. Once viewed primarily as a faster alternative to Ethereum, the network is now emerging as a strategic infrastructure layer for decentralized finance, attracting growing interest from institutional investors. As Solana strengthens its technical foundations, capital inflows from specialized funds are reshaping its position within the crypto ecosystem.
At the start of the year, Solana is no longer defined by potential alone. Instead, it is increasingly recognized as a foundational player at the intersection of real-world use cases and large-scale financial flows.
Institutional Funds Quietly Accumulate SOL
According to market analysts, institutional accumulation of SOL has intensified since the beginning of the year. Crypto analyst Rex noted that several major investment firms are steadily building positions in Solana, a trend echoed by other ecosystem observers.
Among the most prominent investors, Forward Industry reportedly holds close to $1 billion worth of SOL, signaling strong long-term conviction. Other entities, including Defidevcorp and additional institutional funds, are also managing holdings worth several hundred million dollars.
Analysts believe this shift is still in its early stages. Solana stands out as one of the few blockchains capable of combining high performance with scalability, making it increasingly attractive for institutional-grade applications. As Rex put it, the choice to accumulate SOL is not accidental—these investors are positioning themselves for where decentralized infrastructure is heading.
Key factors reinforcing this institutional shift include:
- Forward Industry’s nearly $1 billion SOL position, reflecting strategic commitment
- Multiple funds accumulating large SOL allocations
- Solana’s growing role in real-world asset (RWA) tokenization
- A reassessment by investors who were previously cautious due to centralization concerns
- Expectations that SOL’s major bullish phase is still ahead, despite already significant volumes
This marks a clear change in perception. Solana is no longer seen as a secondary option but increasingly as a core pillar of institutional decentralized finance.
From Promise to Proof: Solana Demonstrates Real-World Readiness
Beyond investment flows, Solana is showing tangible progress in adoption and network performance. One of the most significant milestones is the activation of Firedancer on the mainnet—an independent validator client that reduces block finality to approximately 150 milliseconds, dramatically improving speed, stability, and resilience.
In parallel, Solana’s integration by Western Union underscores its transition into enterprise-scale applications. This move highlights growing confidence in Solana’s ability to support global payment and settlement use cases.
Institutional interest is also reflected in traditional financial products. The SOL spot ETF recently surpassed $1 billion in net assets, a symbolic and practical confirmation that Solana is gaining acceptance beyond the crypto-native investor base.
On-Chain Metrics Confirm Rapid Ecosystem Growth
Network data further supports the narrative of accelerating adoption. According to investor insights, applications built on Solana generated $2.39 billion in revenue in 2025, representing a 46% year-on-year increase. Network-level revenue reached $1.48 billion, reflecting growth multiplied nearly 48 times over the past two years.
Additional on-chain highlights include:
- 3.2 million daily active wallets
- Nearly $900 million in stablecoin inflows in a single day on January 6
- Leadership in decentralized exchange (DEX) volume across both 24-hour and 30-day periods
- Market dominance in tokenized equities and digital securities
These metrics point to sustained, utility-driven demand rather than short-term speculation.
Conclusion
Solana is now attracting long-term capital and sustained usage, moving well beyond temporary hype cycles. As institutional funds accumulate SOL and on-chain fundamentals continue to strengthen, the network’s role within the broader crypto economy is being redefined. While market uncertainty remains a constant, the current momentum suggests Solana is positioning itself as a lasting force in decentralized financial infrastructure rather than a passing alternative.
Greg Kidd, an early executive at Ripple and a long-time figure in the cryptocurrency space, has shared fresh insights into what truly drives XRP’s long-term relevance. Rather than focusing on short-term price fluctuations, Kidd argues that liquidity and supply dynamics are the most critical factors determining XRP’s role and sustainability within the global financial system.
According to Kidd, XRP’s value proposition lies in its ability to function efficiently within payment infrastructure, not in speculative price movements. He believes that without deep and reliable liquidity, XRP cannot fully perform its intended purpose, regardless of how high its market price may rise.
Early XRP Investment Reflects Long-Term Conviction
Kidd revealed in a past interview that he still holds a substantial XRP position, having acquired roughly 1% of the total XRP supply more than five years ago. This investment predates the wave of institutional adoption and modern crypto market infrastructure, underscoring his long-standing confidence in XRP as a financial utility rather than a speculative asset.
His early involvement gives him a rare, long-term perspective on how real value is created within blockchain ecosystems. Kidd views XRP as a tool designed to solve liquidity challenges in global finance, not simply as a vehicle for price appreciation.
XRP’s Role as a Bridge Asset in Ripple’s Ecosystem
Kidd emphasized that XRP’s primary function is to act as a bridge asset within Ripple’s payment network. While Ripple builds enterprise-grade systems for cross-border transfers, XRP enables seamless movement of value between different fiat currencies.
He noted that XRP’s effectiveness is independent of Ripple’s corporate performance. Instead, the token’s strength lies in its ability to provide fast, cost-efficient liquidity across markets, making it suitable for large-scale transactional use.
Liquidity Matters More Than Price
A key takeaway from Kidd’s commentary is that liquidity outweighs price when it comes to XRP’s utility. High liquidity allows participants to move in and out of positions quickly, with minimal slippage—an essential requirement for institutional and cross-border payment use cases.
Kidd explained that even if XRP’s price increases, a lack of deep and efficient markets would limit its usefulness. In contrast, strong liquidity enables XRP to function as a reliable transactional instrument within the global payments ecosystem.
Supply, Demand, and Long-Term Price Potential
While liquidity is central to XRP’s role, Kidd acknowledged that supply constraints and rising demand naturally influence price over time. As adoption grows and markets mature, increased demand relative to available supply could support long-term price appreciation.
However, he stressed that any meaningful upside would be driven by real usage and sustained participation rather than speculation. In his view, price growth should be a byproduct of utility, not the primary objective.
Ripple’s Vision for Blockchain-Based Banking
Beyond XRP, Kidd has shared a broader vision for Ripple’s role in transforming traditional finance. Speaking at the XRP Las Vegas conference in June 2025, he suggested that blockchain technology could modernize legacy banking systems and integrate traditional institutions into decentralized networks.
In his current role as CEO of Vast Bank, Kidd is working on issuing FDIC-insured U.S. dollar tokens on the XRP Ledger. These tokens operate under a fractional-reserve model and aim to deliver capital efficiency, interest generation, regulatory protection, and 24/7 cross-border payment capabilities. He also plans to expand this framework to other currencies, including the British pound and the euro.
Conclusion
Greg Kidd’s perspective reinforces the idea that XRP’s long-term success depends far more on liquidity, structured adoption, and real-world utility than on short-term price action. While price appreciation may follow as markets deepen, Kidd believes XRP’s true value lies in its ability to function as a reliable bridge asset within a modernized global financial system.

BytePlus Joins Hong Kong Web3 Festival 2026 as Gold Sponsor

SignalPlus Announced as Title Sponsor for Hong Kong Web3 Festival

MEET48 Announced as Diamond Sponsor at Hong Kong Web3 Festival

New AI cybercrime tool breaches banking KYC systems using advanced deepfake technology

Bitfire Group Joins Hong Kong Web3 Festival as Diamond Sponsor

ZA Bank Confirms Participation at Hong Kong Web3 Festival

Cardalonia Aiming To Become The Biggest Metaverse Project On Cardano

P2P2C BREAKTHROUGH CREATES A CONNECTION BETWEEN ETM TOKEN AND THE SUPER PROFITABLE MARKET

WOM Protocol partners with CoinPayments, the world’s largest cryptocurrency payments processor

ETHERSMART DEVELOPER’S VISION MADE FINTECH COMPANY BECOME DUBAI’S TOP DIGITAL BANK

Project Quantum – Decentralised AAA Gaming

WOM Protocol Recommended by Premier Crypto Analyst as only full featured project for August
-
 Crypto4 years ago
Cardalonia Aiming To Become The Biggest Metaverse Project On Cardano
-
 Press Release5 years ago
P2P2C BREAKTHROUGH CREATES A CONNECTION BETWEEN ETM TOKEN AND THE SUPER PROFITABLE MARKET
-
 Blockchain6 years ago
WOM Protocol partners with CoinPayments, the world’s largest cryptocurrency payments processor
-
 Press Release5 years ago
ETHERSMART DEVELOPER’S VISION MADE FINTECH COMPANY BECOME DUBAI’S TOP DIGITAL BANK
-
 Press Release5 years ago
Project Quantum – Decentralised AAA Gaming
-
 Blockchain6 years ago
WOM Protocol Recommended by Premier Crypto Analyst as only full featured project for August
-
 Press Release5 years ago
ETHERSMART DEVELOPER’S VISION MADE FINTECH COMPANY BECOME DUBAI’S TOP DIGITAL BANK
-
 Blockchain6 years ago
1.5 Times More Bitcoin is purchased by Grayscale Than Daily Mined Coins